Tag: debugging

Changing the window scope in Firebug

If I had to choose one piece of advice for new web developers, I’d tell them to learn to use Firebug. Firebug is probably the most valuable debugging tool available, but if you are just getting started, it may seem pretty opaque at first.

In addition, some things do not appear to work as advertised. In particular, the “cd” function does nothing as far as I can tell.

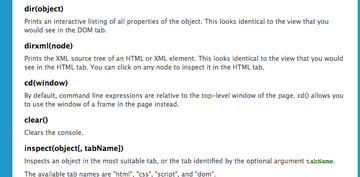
The page that documents the commands you can use within Firebug lists the cd command as a way of changing the window scope:

Picture 23.png

Continue reading

How to analyze Captivate Movie structure

If you want to create widgets that control Captivate files with new functions, other than the standard playbar functions, you will need to develop them in flash. Here’s how to figure out what is going on in a Captivate movie file:

Create a Captivate movie, and publish it (Captivate 2) or export it to Flash (Captivate 3). To create my faster-slower widgets, I had to decompile it into an .fla (I used SWFdecompiler )

Open it in Flash, and start exploring the structure. If you are using version 3, by far the best tool you can use include the “debug movie” command.

Continue reading

Debugging and troubleshooting HTML and javascript

Spreadfirefox Affiliate Button

Firefox, the web developer’s debugging tool of choice

The best browser to use to check javascript errors is Firefox, hands down. Other browsers have some error reporting, but none give you anywhere near the detailed information as Firebug, an addon to Firefox. The extensions available allow you to snoop into every aspect of your page, and into the communication between page and server.

You will need to get several Firefox extensions:

Firebug
Firebug is the one extension I can’t live without. It shows errors in javascript, css, allows you to inspect the HTML source, computed style, events, etc.

Continue reading